Watchlist Tutorial
Our stock watchlist tool allows you to easily keep track of the stocks and funds that you are interested in.
Plus, if you add your holdings to the watchlists, it transforms into a portfolio tracker that shows your total portfolio value, losses, and more.
Here's what a watchlist looks like:
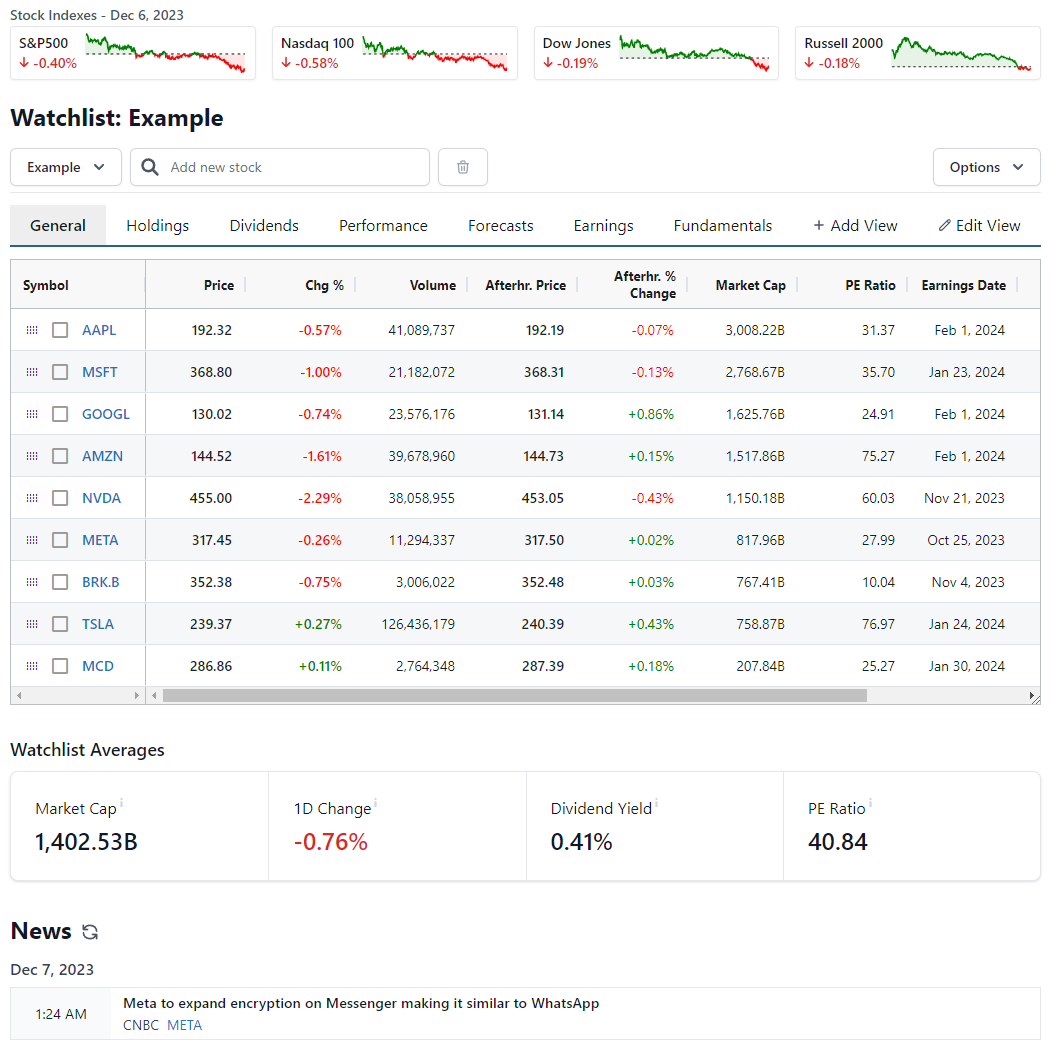
From top to bottom, these are the main features:
- Stock indexes overview: Updates in real-time during open hours, pre-market and after-hours.
- Watchlists dropdown: Add, remove or rename watchlists.
- Add symbols: Use the search bar to find symbols.
- Options button: Change settings, bulk add symbols or export.
- Views menu: Change the set of data points shown, or click "Add" or "Edit" to customize the views.
- Table: This is the grid that lists all the stocks and data points.
- Watchlist averages: The averages of some key numbers for the stocks in your watchlist.
- News: The latest news for the symbols in your watchlist.
How to track your portfolio
If you add your holdings to the watchlist, then it will transform into a portfolio tracker. Here's how to do that:
- Add some stocks to your watchlist.
- Click the "Holdings" view.
- Under "Shares Owned" and "Avg. Price," enter the number of shares you own and the average price you paid for them.
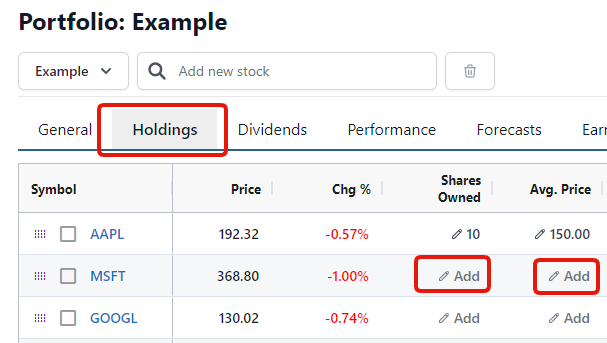
If you are using a computer, you can use the tab key to quickly jump between the different symbols.
After this is complete, the "Holdings" tab will show the value and profits and losses of your positions, plus each position's total percentage of your portfolio.
In addition, the "Watchlist Averages" boxes will transform into a "Portfolio Summary" that shows your portfolio's total value, today's profits and losses, dividend yield and PE ratio:

How to track cash
If you hold cash in your brokerage account, then you can add the cash value to the top right above the Portfolio Summary boxes. This will make your portfolio statistics also account for the cash.
How to add or delete stocks and funds
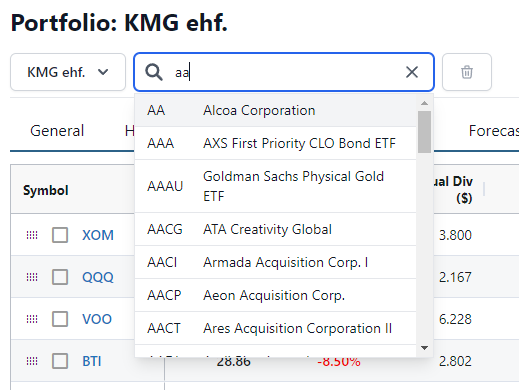
You can add any symbol that is listed on the site. Just type the ticker symbol or name into the search box:
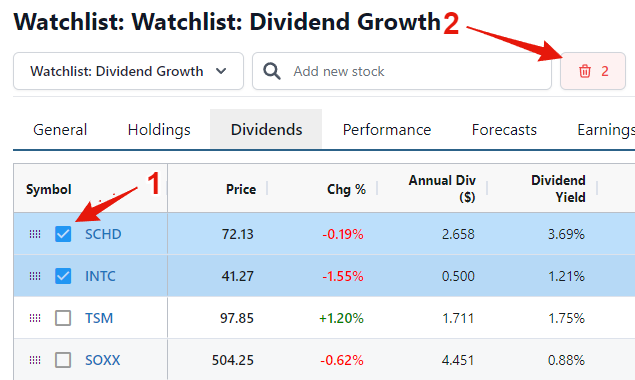
In order to delete a symbol, then click the checkbox next to the symbol name and then the trash icon:
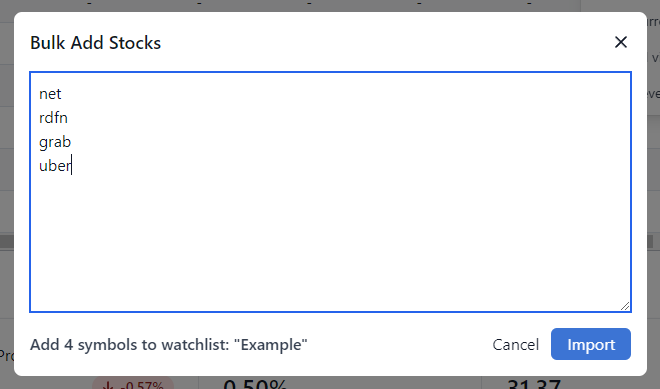
You can also bulk add symbols by clicking "Options" and "Bulk Add Stocks" and then pasting a list of symbols into the box. The symbols can be one per line, space separated or comma separated:
How to add, remove or rename watchlists
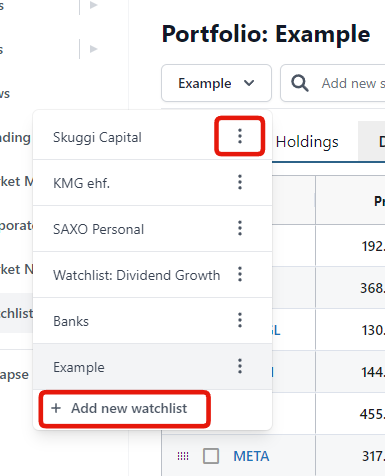
You can use the dropdown to manage your watchlists. You can click "Add new watchlist" to add new lists and you can click the three dot icon next to each watchlist to Delete, Rename or Duplicate a watchlist.
How to customize views
You can click the different views menu items to change which data points are shown in the table.
These are the default views:
- General: A basic overview of the stocks. This view shows pre-market and after-hours price changes when applicable.
- Holdings: If you add your holdings, you can see their values, profits, losses and percentage of total portfolio value.
- Dividends: An overview of dividends, key dates, growth and more.
- Performance: Price change of the symbols over different time periods.
- Forecasts: A summary of analyst forecasts and price targets.
- Earnings: Earnings dates and times, plus revenue and EPS estimates.
- Fundamentals: Overview of financials.
But that's not all, you can also personalize these views by either adding new views or editing the default views.
To add a new view, click "+ Add View" and enter the title of the view.
Then you can click "Edit View" to customize the data points shown in the view:
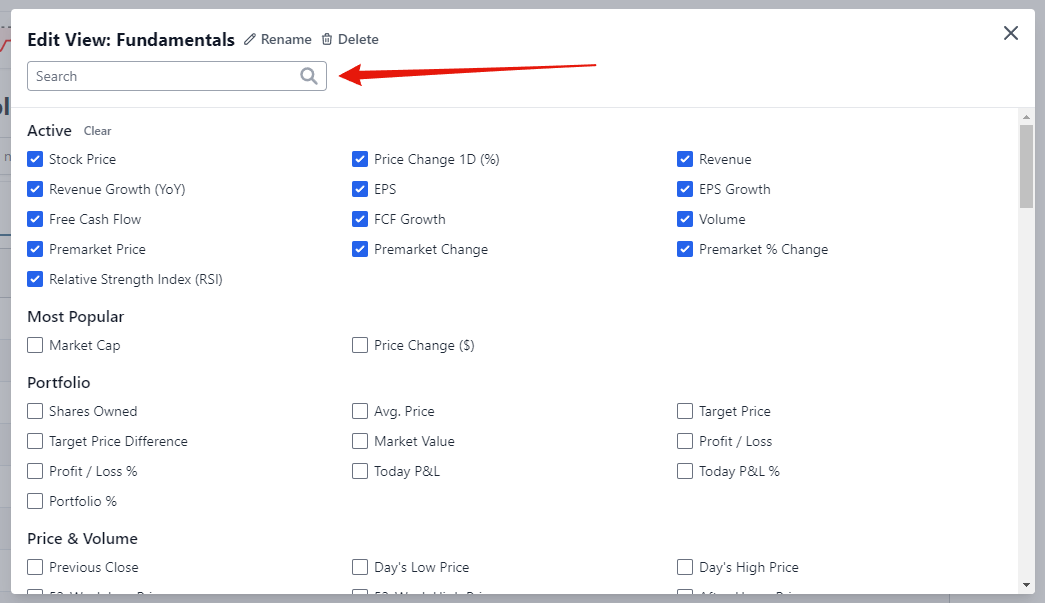
There are well over a hundred individual data points. Use the search box to quickly find what you are looking for.
Next to the title, there are also "Rename" and "Delete" buttons that rename or delete the view.
If you want to change the order of the views, then you can drag and drop the views.

In order to reset the changes to default views, you can click "Options" and "Reset current view" or "Reset all views."
How to sort and reorder symbols
If you want to change the order of the symbols in the watclist, then you can either click the column headers to sort by a specific indicator, or you can drag and drop the symbols to reorder them.
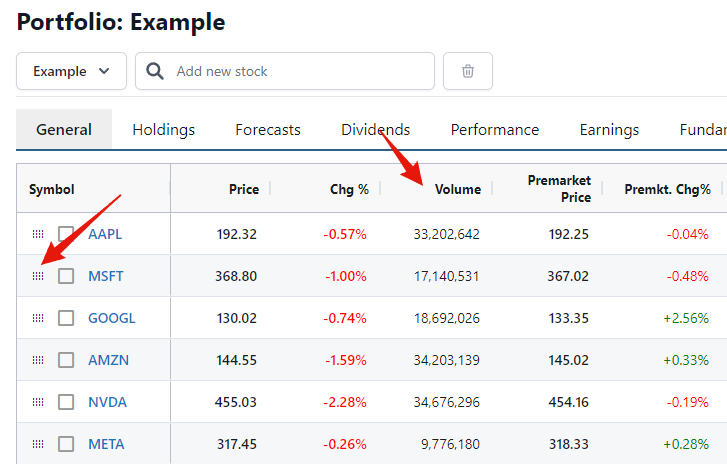
Keep in mind that if a column is sorted, the icon to drag and drop the row disappears. Click the sorted column's header to remove the sorting and then you can drag and drop the row.
How to export your watchlists
To export your watchlist as either a CSV or Excel file, click "Options" and then "Export."

Change the height and width
If you are on a computer, then you can click and drag the icon in the bottom right corner to change the watchlist width and height:
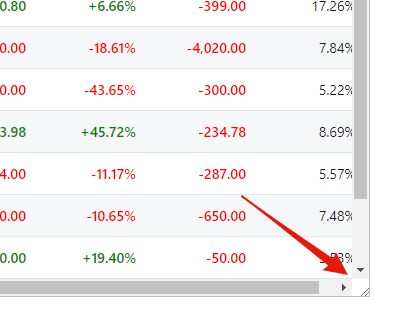
To reset the height and width, click "Options" and "Reset height and width."
The news section
The news shows the latest headlines for the symbols in your watchlist.
If the news item is a video, then click the title to expand the video and watch it directly on the page.
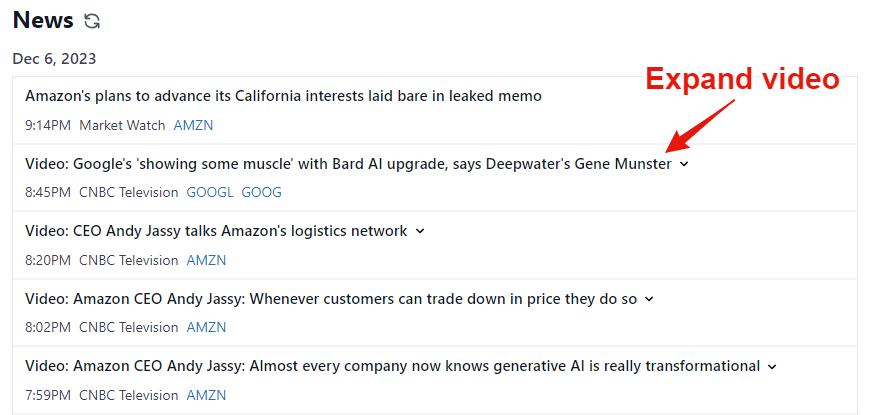
There is also a "Refresh" button above the news section that you can click to refresh the news list.
Additional options
In the "Options" dropdown, there are multiple options:
- Bulk Add Stocks: Paste a list of symbols to bulk add to your watchlist.
- Export to Excel: Export the current view to Excel.
- Export to CSV: Export the current view to a .csv file.
- Realtime updates: Enable or disable real-time price updates.
- Animations: Enable or disable the animations when the stock price changes.
- Reset height and width: If you have changed the height and width of the table, then this will reset it.
- Reset current view: If you changed a default view, then you can reset it here.
- Reset all views: If you changed the views, then you can reset all the changes here.
- Delete everything: Here you can delete all your watchlists, portfolios and views. Keep in mind that these changes are not reversible.